 Image by Wayan Vota via Flickr
DAY 2
BASIC ASSUMPTIONS ON THE USE OF CANDLESTICKS ON SPOT CURRENCY TRADING
USD AGAINST THE MAJORS
There is no doubt that the currency market still regards the USD as the currency to contend with. The bulk of the volume traded in the spot currency market worldwide is still concentrated in the buying or selling of the majors against the USD. This actually simplifies the task for us since we only need to track the rise or fall of the dollar, resulting from the strengthening or the decline of the U.S. economy relative to the economies of the four majors. More often than not, the strengthening of the U.S. economy is often accompanied by the appreciation of the dollar against the majors in varying degrees and conversely, the decline of the U.S. economy is usually followed by the depreciation of the dollar against the majors.
THE TELLTALE SIGNS WE SHOULD BE LOOKING FOR
Similar to all the other technical analysis tools, we also use the candle sticks to determine strengths and weaknesses in market movements. The candlesticks will be our road signs which will tell us whether a market is trending in a particular direction or not, whether a particular trend is about to end, whether a particular trend has been reversed. In short, Japanese Candlestick charts also have their own reversal patterns, patterns that show a continuance of a trend, patterns that warn us of a weakening market movement.
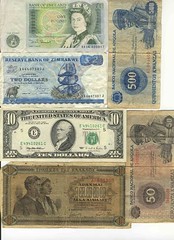 Image by mollyeh11 via Flickr
When I first lectured on the Japanese Candlestick Charts to a group of investors in San Francisco in 1990 the seminar participants never failed to laugh as I mentioned the names of the different candlestick patterns. For example, when I discussed the "Harami" which is basically the "inside day" formation on the Western Charts (where the current price traded in a very narrow range and well inside the range of opening and closing prices of the previous session), my audience had a big laugh when I explained that the Japanese word meant "pregnant woman". You may find the names of the candlestick patterns very amusing and at times very traditional but they vividly express the underlying collective sentiment of the market players at the time the particular pattern was formed. The basic candlestick patterns include such names as "Shooting Star", Evening Star", "Morning Star", "Hammer", "Dark Cloud Cover", Dragon Fly", and many more seemingly simplistic terms.
The success of the Japanese Candlestick charting technique lies in this simplistic pattern recognition. The "Evening star" carries the connotation of a reversal of a bull run, happening as it is after an extended uptrend. The star is basically characterized by a narrow trading range where the opening price is almost the same as the closing price.
I Shall give you a walk through of all these patterns as they appear in the course of my live demo trading starting Monday. In the meantime, let me lay out the rules I follow in the use of the candlesticks.
1. You must give more importance to candlestick patterns which appear and are formed at or near significant highs or lows or at and around recognized support and resistance lines.
2. A confirmation of the pattern after its formation must first occur before you initiate a trade. A confirmation must consist of a candle whose closing at least falls beyond the mid point of the previous sessions candle.
3. When initiating a trade, set a tight auto stop by using the previous candle's close as your stop if you are on a buy, or the previous candle's open if you are on a sell (for USDJPY, USDCHF and vice versa for EURUSD, GBPUSD).
4. Adjust your stops after each session (like a trailing stop) always using the previous session's candle as your reference point.
5. Do not buck the trend. Trade only in the direction the candles are leading you. Consult the monthly candlestick chart for the market trend. Use the daily candle charts to initiate positions. Shorter period charts like the hourly and 5 minute charts are only for day traders. I have found candlestick charts to be more effective for position traders (and not so effective for scalping).
6. Every position taken must not only be based on a candle pattern but should also have an underlying economic fundamental currently existing or as anticipated by major market players.
7. When you are on a buy, use the nearest most significant resistance as your first profit objective and immediately take profits by liquidating positions when the current candle fails to break the resistance towards the close of the session. When you are on a sell, use the nearest most significant support as your first profit objective. (for USDJPY, USDCHFonly, vice versa for EURUSD, GBPUSD).
For now, these are the ground rules we will follow when we begin to trade on Monday. I shall discuss the others as we trade.
THE USDJPY CANDLESTICK CHART AND WHAT IT TELLS US

With the benefit of hindsight, we can easily see the effectiveness of the candlestick patterns in determining market reversals. A classic Reversal Pattern called "The Evening Star" was formed from May, 2007 to July 2007 after USDJPY reached a historical high somewhere around 124. This was when the "bubble started to burst" as predicted by many economists. The reversal brought the rate down to around 96 in March, 2008. The dollar made a laborious run up to around the 111 high in August, 2008. The run up was characterized by narrow trading ranges which tells us that the rally is not attracting dollar buyers at all and that the dismal outlook on the U.S. economy is more pervasive and it is keeping the dollar bulls sidelined. True enough, another classic candlestick reversal pattern was formed. August, 2008 developed what is termed as the "Evening Star" promptly followed by a confirmation candle(September, 2008) which significantly closed below the midpoint of the reference candle (July, 2008). The reversal brought the price down to the January, 2009 low of 87. Significantly, a market weakness (possibly a reversal) in the current downtrend is evident. A "Hammer" was formed last month signalling a possible near term run up for the USD. This must however, be confirmed with close above the 93 level this month.
With an economic stimulus package almost in place, a better than bleak outlook for the U.S. economy may be in the offing and a dollar rally may be had in the near term..
Notes:

EVENING STAR
Recognition: A three candle pattern at the top of an uptrend. The body of the first candle is white, confirming the current uptrend. The second candle is an indecisive formation. The third candle is black and should close at least halfway down the white candle.
Pattern Psychology: After an apparant uptrend the Bears step in and open the price lower than the previous day's open. The price finishes lower for the day and the Bulls are concerned and begin selling to take their profits.

SHOOTING STAR
Recognition: One candle pattern appearing in an uptrend. The shadow (or tail) should be at least two times the length of the body. The color of the body is not important, although a black body has slightly more Bearish indications.
Pattern Psychology: After a strong uptrend the Bulls appear to still be in control with price opening higher, but by the end of the day the Bears step in and take the price back down to the lower end of the trading range. Lower trading the next day reinforces the probability of a pullback.

HAMMERS and HANGING-MAN
Recognition: The lower shadow (or tail) should be at least two times the length of the body. The color of the body is not important although a black body has slightly more Bearish indications and a white body has slightly more Bullish indications.
Pattern Psychology: This pattern at the bottom of a down trend is called a Hammer. This pattern at the top of an uptrend is called a Hanging-Man
![Reblog this post [with Zemanta]](http://img.zemanta.com/reblog_e.png?x-id=98c0f7e2-9a33-44b7-ba17-f3a5d894c25e)
No comments:
Post a Comment